

Contents
- What is Rapfish, and why MDS?
- Why Rapython was developed
- What Rapython does
- Requirements and download
- How to run an MDS-Rapfish analysis in Rapython
- 1. Prepare the data in Excel
- 2. Enter the row positions
- 3. Run the main analysis
- 4. Run the leverage analysis
- 5. Check stability with Monte Carlo
- How does Rapython compare with the Excel template?
- Video walkthrough (in Indonesian)
- Frequently asked questions
- Is Python knowledge required to use Rapython?
- Can Rapython run on Mac or Linux?
- Can Rapython be used for studies outside fisheries?
- Why do Rapython results differ slightly from the Excel add-in?
- What stress value is acceptable in MDS-Rapfish?
- References and further reading
Versi bahasa Indonesia: Rapython : Multidimensional Scaling Rapfish Basis Python
Short answer: Rapython is a portable Windows application, written in Python, that runs Rapfish-style multidimensional scaling (MDS) sustainability analysis without any coding. The user loads the same Excel layout used by the classic Rapfish Excel template, clicks Run Rapfish, and obtains a 0–100 sustainability index for each object, followed by leverage analysis and a Monte Carlo stability check, all of which can be exported to Excel. The application was developed because the Excel add-in became unreliable on modern 64-bit computers, while the R scripts remained difficult for many students.
What is Rapfish, and why MDS?
Rapfish (Rapid Appraisal for Fisheries) was developed at the Fisheries Centre of the University of British Columbia by Tony Pitcher and David Preikshot to rate the sustainability of fisheries rapidly, using many simple attributes scored by researchers. Each fishery is described by attributes grouped into dimensions such as ecological, economic, social, technological, and institutional. Multidimensional scaling then places every fishery on a map between two artificial reference points: a “bad” fishery with the worst possible score on every attribute and a “good” fishery with the best.
The method has spread far beyond fisheries. In Indonesia, MDS-Rapfish is now a standard tool in theses and journal articles on the sustainability of farming systems, livestock, plantations, tourism, rural development, and regional planning. The common Indonesian convention reads the index as follows: 0–25 not sustainable; 25–50 less sustainable; 50–75 fairly sustainable; and 75–100 sustainable.
Why Rapython was developed
Students and researchers who use Rapfish usually rely on one of two tools, and both create recurring problems. The Excel add-in depends on the host Excel installation; it conflicts with other add-ins and macros, provides almost no error messages, and runs only on 32-bit Excel, which is increasingly difficult to maintain on 64-bit computers. Consequently, an incorrect result can go unnoticed. The R scripts, in contrast, are fast and run on any machine; however, many students struggle with scripting, and the commonly shared scripts do not report the stress and R² values that reviewers expect.
Rapython combines the strengths of both: results comparable to the Excel template, delivered through a graphical interface in which the user only points to the data. The order of work follows the Excel add-in, thereby allowing anyone who learned Rapfish in Excel to switch without retraining.
What Rapython does
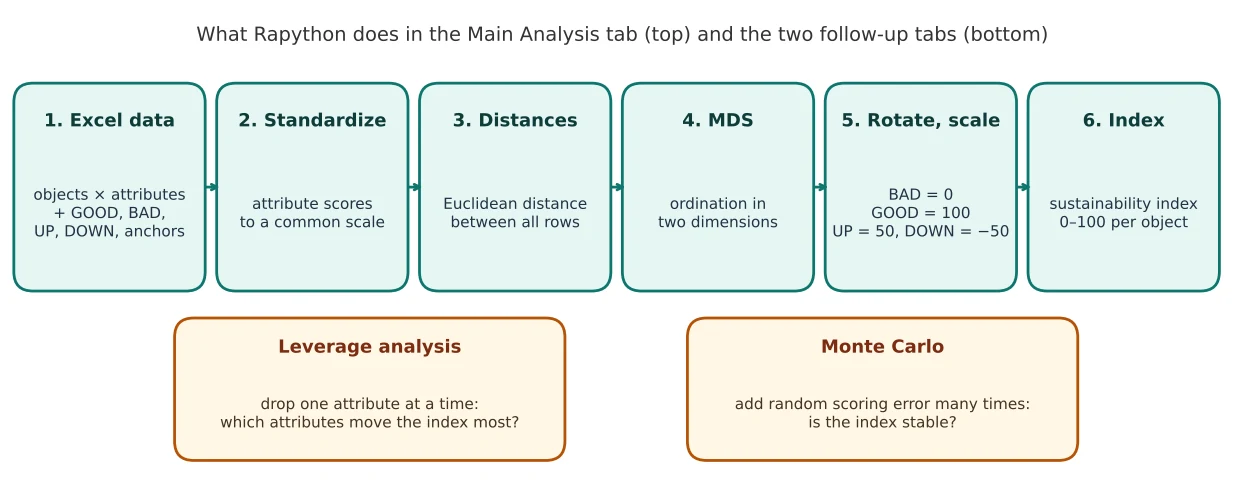
The application has three tabs (Table 1). Under the hood, it uses established Python libraries: pandas for data handling, scikit-learn for MDS and distance calculations, matplotlib for the plots, and Tkinter for the interface.
| Tab | Process | Output |
|---|---|---|
| Main Analysis | Standardizes the attribute scores (using the data range or a fixed GOOD–BAD range), computes Euclidean distances, runs MDS, then rotates and scales the solution so that BAD = 0, GOOD = 100, UP = 50, and DOWN = −50. Anchor points are supported. | Sustainability index per object, interactive ordination plot, Excel export |
| Leverage Analysis | Removes one attribute at a time and measures the resulting change in the index. | Ranking of the most sensitive attributes, Excel export |
| Monte Carlo | Repeats the analysis many times with random scoring error, using the chosen number of iterations and noise level. | Index under uncertainty, for comparison with the MDS index |
Requirements and download
Rapython runs on 64-bit Windows and was developed and tested on Windows 11 with 8 GB of RAM. No Python installation is required: the application is portable and opens directly after the download is extracted. The first launch can take a little longer, because the Python libraries are loaded at start-up. Rapython is available from the Catatan Budi course site: Rapython: MDS-Rapfish in Python.
How to run an MDS-Rapfish analysis in Rapython
1. Prepare the data in Excel
The data follow the layout of the Rapfish Excel template, with one sheet per dimension. Each row is an object (a fishery, a village, or a farming system) and each column is an attribute scored on its own scale. The reference rows (GOOD, BAD, UP, DOWN, and the anchors) are placed below the objects, and the file is saved as .xlsx.
2. Enter the row positions
After the file is opened, Rapython asks for the row positions of the objects and of each reference point. One detail causes most errors: Python counts rows from 0, whereas Excel counts from 1. Thus, every Excel row number must be reduced by 1; a GOOD row located in Excel row 30 is entered as 29.

3. Run the main analysis
Clicking Run Rapfish computes the index for each object and draws the ordination plot, with the objects positioned between BAD and GOOD. The results can be exported to Excel to build the result tables or a kite (radar) diagram across dimensions.
4. Run the leverage analysis
In the Leverage tab, Run Leveraging ranks the attributes by how much the index changes when each one is removed. These leverage attributes indicate the conditions that matter most for sustainability, and they are suitable inputs for a follow-up analysis of key drivers with MICMAC analysis.
5. Check stability with Monte Carlo
The Monte Carlo tab requires the number of iterations and the noise level. A Monte Carlo index close to the MDS index indicates that the result is robust to scoring errors. Because Monte Carlo is a random simulation, the results vary slightly from run to run; the settings used should therefore be reported.
How does Rapython compare with the Excel template?
A comparison on the same dataset, using the Rapfish Excel template as the benchmark, showed a difference of about 3% in the MDS index. Differences of this size are expected when two programs implement MDS with different algorithms and programming languages, and the Monte Carlo step adds its own run-to-run variation. Thus, a thesis or an article should state the software used and apply the same software to all dimensions.
Video walkthrough (in Indonesian)
The walkthrough below is narrated in Indonesian; however, the sequence of clicks and the interface can be followed without the language.
Frequently asked questions
Is Python knowledge required to use Rapython?
No. Rapython is a graphical application: the user selects the Excel file, enters the row numbers, and clicks the buttons. Python runs inside the application, so no Python installation or coding is required.
Can Rapython run on Mac or Linux?
Not at present. The packaged application is built for 64-bit Windows only.
Can Rapython be used for studies outside fisheries?
Yes. Rapfish was designed for fisheries, but the method only requires objects scored on attributes with clear good and bad reference values. Studies on agriculture, livestock, plantations, tourism, and regional development follow exactly the same steps.
Why do Rapython results differ slightly from the Excel add-in?
MDS has no single closed-form solution: each program uses its own algorithm, starting configuration, and rounding, and Monte Carlo adds randomness. Small differences of a few percent are normal. Large differences usually indicate that a row number was entered without subtracting 1 or that a reference row is missing.
What stress value is acceptable in MDS-Rapfish?
The Rapfish literature commonly treats a stress value below 0.25 as an acceptable fit, together with an R² close to 1. Both values should be reported for every dimension.
References and further reading
- Pitcher, T. J., & Preikshot, D. (2001). RAPFISH: a rapid appraisal technique to evaluate the sustainability status of fisheries. Fisheries Research, 49(3), 255–270.
- Kavanagh, P., & Pitcher, T. J. (2004). Implementing Microsoft Excel software for Rapfish: a technique for the rapid appraisal of fisheries status. Fisheries Centre Research Reports, 12(2). University of British Columbia.
- Indonesian version of this article: Rapython: Aplikasi MDS Rapfish Berbasis Python.
- Weaknesses of MDS-Rapfish (Indonesian): Kelemahan MDS-Rapfish yang Perlu Diketahui Peneliti.



Discussion
No comments yet. Have a question about this topic? Write it below and I will do my best to answer.