

Contents
- What is the Policy Analysis Matrix?
- The structure of the matrix
- Private prices and social prices
- PAM indicators and how to read them
- Worked example: shallot farming
- Interactive PAM calculator
- Steps to build a PAM
- Common mistakes
- Frequently asked questions
- What is the difference between PCR and DRC?
- What does an NPCO greater than 1 mean?
- How are social prices for labor and land determined?
- Can the PAM be used for livestock, fisheries, or processing?
- Is a PAM template available?
- References and further reading
Versi bahasa Indonesia: Pengantar Policy Analysis Matrix (PAM)
Short answer: The Policy Analysis Matrix (PAM) is a two-way accounting table that compares the revenues, costs, and profits of a farming system at actual market prices (private prices) and at efficiency prices (social prices). The difference between the two rows measures the effect of policies and market failures. From the matrix, a set of ratios is derived: the private cost ratio (PCR) shows competitiveness, the domestic resource cost ratio (DRC) shows comparative advantage, and the protection coefficients show whether policies help or tax producers.
What is the Policy Analysis Matrix?
The PAM was developed by Eric Monke and Scott Pearson (1989) to answer three questions about an agricultural system: (1) whether it is competitive at the prices that farmers actually face; (2) whether it uses the country’s resources efficiently, that is, whether it has a comparative advantage; and (3) how much existing policies, such as tariffs, import restrictions, and input subsidies, transfer income to or away from producers. The method has been applied extensively in Indonesia; Pearson, Gotsch, and Bahri (2004) document a large set of PAM studies on Indonesian food crops, horticulture, and estate crops.
The strength of the PAM is its transparency. Every indicator comes from a single table built from farm budgets, so policymakers can trace each conclusion back to a revenue or cost item. Thus, the PAM remains a standard tool for agribusiness competitiveness studies, theses, and policy briefs.
The structure of the matrix
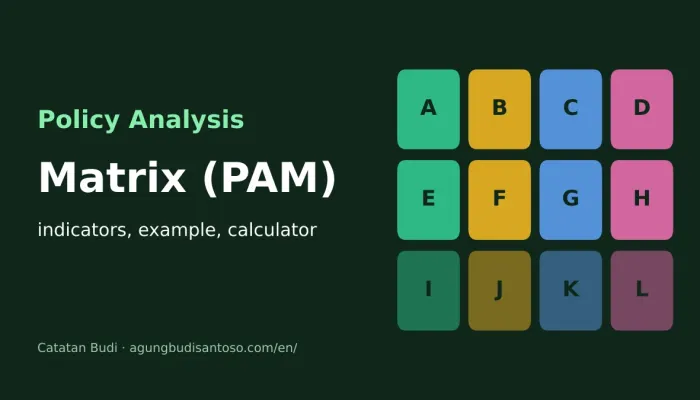
The matrix has three rows and four columns (Table 1). Costs are divided into tradable inputs, which are traded internationally and can be valued at world prices (fertilizer, pesticides, fuel, and often seed), and domestic factors, which are not traded internationally (labor, land, and capital).
| Revenue | Tradable inputs | Domestic factors | Profit | |
|---|---|---|---|---|
| Private prices | A | B | C | D = A − B − C |
| Social prices | E | F | G | H = E − F − G |
| Divergences | I = A − E | J = B − F | K = C − G | L = D − H |
Table 1. Layout of the Policy Analysis Matrix (Monke and Pearson, 1989).
Private profit (D) shows whether the system is profitable for farmers under current prices and policies. Social profit (H) shows whether it would be profitable without distortions, which is the economic measure of efficiency. The divergence row isolates the effect of policies and market failures: a positive I indicates that farmers receive more for their output than the world market would pay, and a negative J indicates that tradable inputs are cheaper for farmers than at world prices.
Private prices and social prices
Private prices are the observed prices received and paid by farmers, taken from farm surveys. Social prices are efficiency prices. For tradable goods, the social price is the border parity price: for an imported commodity, the CIF import price is converted at the exchange rate and adjusted for port handling and transport costs to the farm gate; for an exported commodity, the calculation starts from the FOB export price. For domestic factors, the social price is the opportunity cost of the resource. In many Indonesian food crop studies, labor, land rent, and capital are assumed to have the same private and social prices because these markets are considered relatively undistorted; this assumption should be stated explicitly in any report.
PAM indicators and how to read them
Seven ratios are commonly reported (Table 2). The two efficiency indicators, PCR and DRC, are read against a threshold of 1; the protection coefficients describe the direction and size of policy transfers.
| Indicator | Formula | Reading |
|---|---|---|
| Private cost ratio (PCR) | C / (A − B) | < 1: competitive at private prices |
| Domestic resource cost ratio (DRC) | G / (E − F) | < 1: comparative advantage |
| Nominal protection coefficient on output (NPCO) | A / E | > 1: output price protected |
| Nominal protection coefficient on inputs (NPCI) | B / F | < 1: tradable inputs subsidized |
| Effective protection coefficient (EPC) | (A − B) / (E − F) | > 1: value added protected |
| Profitability coefficient (PC) | D / H | > 1: policies raise private profit |
| Subsidy ratio to producers (SRP) | L / E | Net transfer as a share of social revenue |
Table 2. Main PAM indicators.
Worked example: shallot farming
The example uses a simulated budget for one hectare of shallot over one growing season, in million rupiah. Yield is 10 tonnes; the farm-gate price is Rp25,000 per kilogram, while the import parity price at the farm gate is Rp22,000 per kilogram, reflecting import restrictions. Fertilizer is subsidized, so tradable inputs cost less at private prices than at social prices. The figures are illustrative, not survey results.
| Revenue | Tradable inputs | Domestic factors | Profit | |
|---|---|---|---|---|
| Private prices | 250 | 60 | 130 | 60 |
| Social prices | 220 | 70 | 135 | 15 |
| Divergences | 30 | −10 | −5 | 45 |
Table 3. Simulated PAM for shallot (million rupiah per hectare per season).
The results reveal the dual role of current policy: it makes shallot farming highly profitable for farmers, yet simultaneously masks a thin efficiency margin. The PCR of 0.68 shows that the system is competitive at private prices, and the DRC of 0.90 confirms a comparative advantage, although the margin is narrow; an increase of about 11% in the social cost of domestic factors would remove it. The NPCO of 1.14 indicates that farmers receive 14% more than the import parity price, and the NPCI of 0.86 reflects the fertilizer subsidy. Combined, the EPC of 1.27 shows that policies raise value added by 27%. Private profit is four times social profit (PC = 4.0), and the net policy transfer to producers equals 20.5% of social revenue (SRP = 0.205). Thus, the competitiveness of this system depends substantially on protection; improving productivity and reducing domestic factor costs would be essential to retain the comparative advantage if import restrictions were relaxed.
Interactive PAM calculator
The calculator below starts with the worked example. Changing any of the six inputs recalculates the matrix and all seven indicators, which makes it useful for sensitivity analysis, for example to test how much the import parity price can fall before DRC exceeds 1.
| Revenue | Tradable | Domestic | Profit | |
|---|---|---|---|---|
| Private | ||||
| Social | ||||
| Divergence |
- PCR
- DRC
- NPCO
- NPCI
- EPC
- PC
- SRP
Steps to build a PAM
A PAM study generally follows five steps: (1) collect representative farm budgets, with input quantities, output, and prices, from a farm survey; (2) separate every cost item into tradable and domestic components, including the tradable share of items such as machinery services or transport; (3) calculate border parity prices for the output and tradable inputs, together with the shadow exchange rate if the official rate is distorted; (4) value domestic factors at their opportunity cost; and (5) fill the matrix, compute the indicators, and test their sensitivity to the most uncertain prices. Step 3 usually requires the most care, because the import or export parity calculation determines E and F.
Common mistakes
Four mistakes appear repeatedly in PAM studies: (1) treating all inputs as tradable or all as domestic, instead of decomposing mixed items; (2) using a domestic wholesale price as the social output price, which removes the protection effect that the PAM is meant to measure; (3) reporting DRC without a sensitivity analysis, although small changes in world prices or the exchange rate can move DRC across the threshold of 1; and (4) presenting PC when social profit H is close to zero or negative, which makes the ratio unstable and misleading. In the last case, SRP and the divergence row are more informative.
Frequently asked questions
What is the difference between PCR and DRC?
PCR uses private prices and measures competitiveness under current policies, whereas DRC uses social prices and measures comparative advantage, that is, efficiency without policy distortions. A system can be competitive (PCR < 1) without a comparative advantage (DRC > 1) when it survives only because of protection or subsidies.
What does an NPCO greater than 1 mean?
An NPCO above 1 means that the private output price exceeds the social price, so policies such as tariffs or import restrictions protect producers. Consumers pay the cost of this protection through higher prices.
How are social prices for labor and land determined?
Social prices for domestic factors reflect their opportunity cost: the wage in the best alternative employment for labor, and the rent or the return of the best alternative crop for land. When factor markets function reasonably well, observed wages and rents are often used as social prices, and the assumption is stated in the report.
Can the PAM be used for livestock, fisheries, or processing?
Yes. The matrix applies to any production system with identifiable revenues and costs, including livestock, aquaculture, estate crops, and agro-processing. Value chains can be analyzed by building one matrix for each stage.
Is a PAM template available?
A PAM spreadsheet template for practice is available from the Catatan Budi course site: PAM template. The calculator above reproduces the core calculations for quick checks.
References and further reading
- Monke, E. A., & Pearson, S. R. (1989). The Policy Analysis Matrix for Agricultural Development. Cornell University Press.
- Pearson, S., Gotsch, C., & Bahri, S. (2004). Applications of the Policy Analysis Matrix in Indonesian Agriculture. Yayasan Obor Indonesia.
- Indonesian introduction: Policy Analysis Matrix (PAM): Pengertian dan Tabel.
- Indonesian guide to the indicators: Indikator Policy Analysis Matrix (PAM): NPCO, EPC, PCR.


Discussion
No comments yet. Have a question about this topic? Write it below and I will do my best to answer.