


Contents
- What is MICMAC analysis?
- When is MICMAC the right method?
- Step 1: List the variables
- Step 2: Choose the experts and collect the scores
- Step 3: Fill the direct influence matrix
- Worked example: a shallot farming system
- Step 4: Read direct influence and dependence
- Step 5: Compute indirect influence
- Step 6: Read the influence–dependence map
- Step 7: Compare direct and indirect results
- Common mistakes
- Frequently asked questions
- Where is MICMAC software available?
- How many experts are needed for MICMAC analysis?
- What does P mean in the MICMAC matrix?
- What is the difference between MICMAC and ISM?
- How many iterations should MICMAC use?
- References and further reading
Versi bahasa Indonesia: Tutorial Micmac Analysis
Short answer: MICMAC analysis ranks the variables of a system by how much they influence the others and how much they depend on them. Experts score a direct influence matrix from 0 to 3, the matrix is multiplied by itself to reveal indirect influence, and every variable lands in one of four zones on an influence–dependence map: influential drivers, relay variables, dependent results, or autonomous variables. Thus, the drivers are the variables on which a policy or a project should act first.
This tutorial explains the whole method with a small worked example from shallot farming in Indonesia. Every number can be traced in the accompanying Excel file, which recalculates automatically when new scores are entered.
What is MICMAC analysis?
MICMAC stands for Matrice d’Impacts Croisés – Multiplication Appliquée à un Classement, roughly “cross-impact matrix multiplication applied to ranking”. It is the core tool of structural analysis in the French strategic foresight school (la prospective). Michel Godet and Jean-Claude Duperrin proposed the operational method in the early 1970s during a futures study on nuclear energy in France, and Godet later developed it into the version used today.
The idea is simple. A system is described as a list of variables. Some variables push the system; others mostly react to it. Asking experts directly “which factor matters most?” tends to produce the obvious answers. MICMAC instead asks a narrower question many times over, “does variable A directly influence variable B, and how strongly?”, and lets matrix algebra reveal the less obvious, indirect chains of influence.
When is MICMAC the right method?
MICMAC is useful when a problem has many interacting factors and only a few of them can be addressed first. Typical applications include (1) identifying the key drivers of a sustainability or development program before recommendations are written; (2) preparing scenario planning, in which the influential variables become the axes of the scenarios; and (3) prioritizing interventions in agribusiness, fisheries, regional development, or organizational strategy.
In Indonesian agricultural and fisheries research, MICMAC is often paired with MDS-Rapfish. The two answer different questions. Rapfish produces a sustainability index and identifies the sensitive attributes through leverage analysis. MICMAC does not produce an index; it produces maps and rankings that show which of those attributes actually drive the others, now and in the longer run. Running leverage analysis first and feeding the sensitive attributes into MICMAC is a common and sensible sequence.
Step 1: List the variables
Start with an inventory of every variable that could shape the system, drawn from the literature, field data, and interviews. Define each one in a sentence so that every expert scores the same thing. “Extension services” is vague; “frequency and quality of visits by government agricultural extension officers” is scoreable.
Godet’s guidance is that a list should not normally go beyond about 80 variables. In practice, a thesis or a district study works well with 10 to 30. Every extra variable adds a full row and a full column for the experts to score, so a long list quickly becomes tiring and the scores get careless.
Step 2: Choose the experts and collect the scores
Invite people who know the system from different angles: farmers or practitioners, government officers, researchers, and traders or private-sector actors. A multidisciplinary group gives better scores than a group of specialists from one field.
A panel of about seven experts is usually sufficient. An odd number is preferable because the final score of each cell is the mode of the experts’ scores, and an odd panel reduces ties. Scores can be collected with a questionnaire or in a focus group discussion (FGD). At least two sessions are needed: the first agrees on the variable list and the definitions; the second fills the matrix and confirms the results.
Step 3: Fill the direct influence matrix
The matrix has the same variables in its rows and columns. Each cell answers one question: does the row variable directly influence the column variable? The standard MICMAC scale is:
| Score | Meaning |
|---|---|
| 0 | No direct influence |
| 1 | Weak influence |
| 2 | Moderate influence |
| 3 | Strong influence |
| P | Potential influence: not present today, but plausible in the future |
Three rules prevent most scoring mistakes. Firstly, the diagonal stays empty, since a variable does not influence itself. Secondly, direction matters: credit can strongly influence seed quality while seed quality has no influence on credit. Unlike AHP, the matrix is not reciprocal; the lower half should never be filled by mirroring the upper half. Thirdly, only direct influence is scored. If A affects C only through B, the experts score A→B and B→C and leave A→C at 0; the matrix multiplication finds the indirect path, and scoring it directly would count it twice.
Worked example: a shallot farming system
To make the steps concrete, here is a small simulated matrix for a shallot (Allium cepa var. aggregatum) farming system in an Indonesian district. The scores are illustrative, written for teaching, not results from a real survey. Each row shows how strongly that variable influences the variables in the columns.
| Influence of ↓ on → | Seed | Credit | Extension | Group | Irrigation | Pests | Yield | Price | Row sum |
|---|---|---|---|---|---|---|---|---|---|
| Seed quality | – | 0 | 0 | 0 | 0 | 2 | 3 | 1 | 6 |
| Access to credit | 3 | – | 0 | 1 | 2 | 1 | 1 | 0 | 8 |
| Extension services | 2 | 1 | – | 3 | 1 | 2 | 2 | 0 | 11 |
| Farmer group strength | 2 | 2 | 1 | – | 2 | 1 | 1 | 2 | 11 |
| Irrigation | 0 | 0 | 0 | 0 | – | 1 | 3 | 0 | 4 |
| Pest pressure | 0 | 0 | 0 | 0 | 0 | – | 3 | 1 | 4 |
| Yield | 0 | 1 | 0 | 1 | 0 | 0 | – | 2 | 4 |
| Farm-gate price | 1 | 2 | 0 | 1 | 0 | 0 | 1 | – | 5 |
| Column sum | 8 | 6 | 1 | 6 | 5 | 7 | 14 | 6 | 53 |
Download the workbook to see every formula: MICMAC worked example (Excel, simulated data).
Step 4: Read direct influence and dependence
The row sum of a variable is its direct influence: how much it acts on the rest of the system. The column sum is its direct dependence: how much the rest of the system acts on it. MICMAC usually expresses both as a share of the matrix total so that variables can be compared on one map.
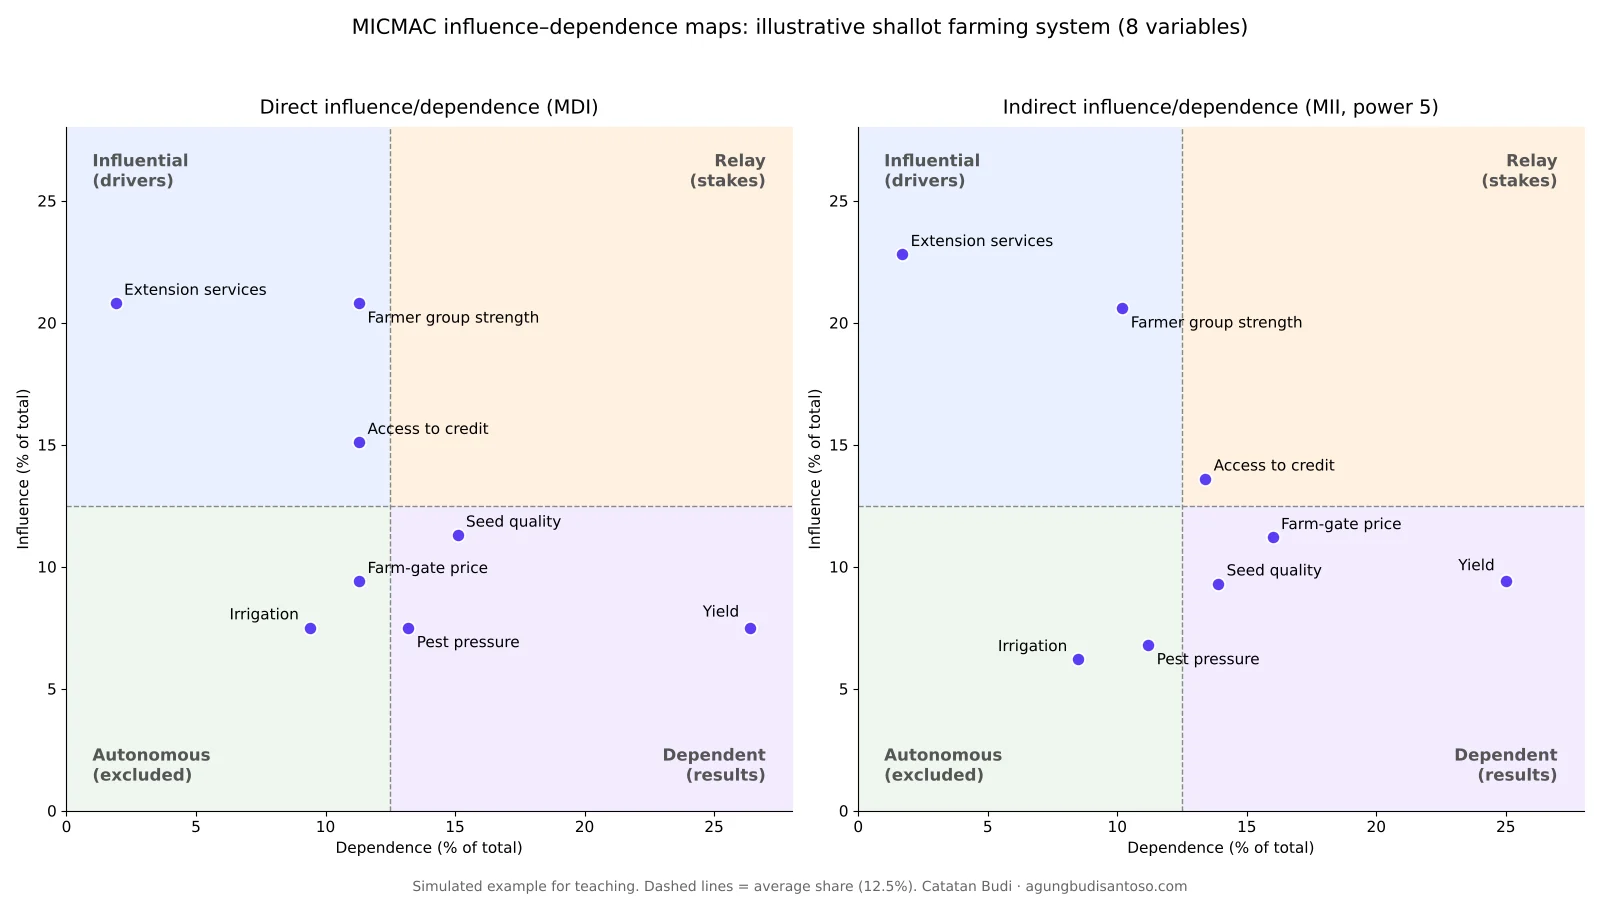
In the example, extension services (11 of 53, about 21%) and farmer group strength (also about 21%) have the highest influence. Yield has by far the highest dependence (14 of 53, about 26%). That is intuitive: yield is the result of almost everything else, which is exactly why it is a poor lever to push on directly.
Step 5: Compute indirect influence
Direct scores miss chains such as extension → farmer group → credit → seed quality → yield. MICMAC captures them by raising the matrix to successive powers. In the squared matrix, each cell adds up all two-step paths between two variables; in the cubed matrix, all three-step paths; and so on. The influence and dependence totals of these powered matrices give the matrix of indirect influences (MII), as opposed to the matrix of direct influences (MDI).
The multiplication stops when the ranking no longer changes. In Godet’s experience, this happens after paths of about four or five steps, which is why the software rarely goes beyond the seventh or ninth power. In the example, the influence ranking is stable from the third power and the dependence ranking from the fourth, so the results below use the fifth power. MICMAC software asks for the number of iterations; always check that the ranking has stabilized rather than accepting the default.
For readers who prefer code to a spreadsheet, the whole computation fits in a few lines of Python:
import numpy as np

M = np.array([...])                 # 8 x 8 direct influence matrix, diagonal = 0
direct_infl = M.sum(axis=1)         # row sums
direct_dep  = M.sum(axis=0)         # column sums

M5 = np.linalg.matrix_power(M, 5)   # indirect influence (paths of length 5)
indirect_infl = M5.sum(axis=1) / M5.sum() * 100
indirect_dep  = M5.sum(axis=0) / M5.sum() * 100
Step 6: Read the influence–dependence map
Each variable is plotted with dependence on the horizontal axis and influence on the vertical axis. Lines at the average share (100% divided by the number of variables, 12.5% here) split the plane into zones.
| Zone | Position | What it means | Example result |
|---|---|---|---|
| Influential (drivers) | High influence, low dependence | Determine how the system evolves; the first place to act | Extension services, farmer group strength |
| Relay (stakes) | High influence, high dependence | Unstable: they pass on any change, and acting on them affects the drivers too | Access to credit (indirect map) |
| Dependent (results) | Low influence, high dependence | Outcomes to monitor, not levers | Yield, farm-gate price, seed quality |
| Autonomous (excluded) | Low influence, low dependence | Weakly connected to the rest; often safe to drop from the analysis | Irrigation |
Variables close to the center of the map, near both average lines, are sometimes called regulating variables: moderately influential and moderately dependent, they can tip towards any zone.
Step 7: Compare direct and indirect results
The most useful insight from MICMAC often comes from what moves between the two maps, because the indirect map describes the system in the longer run.
| Variable | Influence % (direct) | Dependence % (direct) | Zone (direct) | Influence % (indirect) | Dependence % (indirect) | Zone (indirect) |
|---|---|---|---|---|---|---|
| Extension services | 20.8 | 1.9 | Influential | 22.8 | 1.7 | Influential |
| Farmer group strength | 20.8 | 11.3 | Influential | 20.6 | 10.2 | Influential |
| Access to credit | 15.1 | 11.3 | Influential | 13.6 | 13.4 | Relay |
| Seed quality | 11.3 | 15.1 | Dependent | 9.3 | 13.9 | Dependent |
| Farm-gate price | 9.4 | 11.3 | Autonomous | 11.2 | 16.0 | Dependent |
| Pest pressure | 7.5 | 13.2 | Dependent | 6.8 | 11.2 | Autonomous |
| Yield | 7.5 | 26.4 | Dependent | 9.4 | 25.0 | Dependent |
| Irrigation | 7.5 | 9.4 | Autonomous | 6.2 | 8.5 | Autonomous |
Three findings would enter the recommendations of this simulated study. Firstly, extension services and farmer groups are the drivers in both maps; a program that strengthens them affects almost every variable downstream. Secondly, access to credit becomes a relay variable in the indirect map: credit programs are powerful, yet simultaneously sensitive to the rest of the system, so a credit scheme launched without stronger farmer groups is likely to be unstable. Thirdly, the farm-gate price becomes dependent in the long run. Price is shaped by the system rather than shaping it; consequently, price interventions alone will not resolve low productivity.
Common mistakes
Five mistakes appear repeatedly in theses and manuscripts that use MICMAC: (1) scoring indirect influence as if it were direct, which double-counts paths; (2) mirroring the matrix as if influence were reciprocal; (3) listing too many vaguely defined variables, which leads experts to score by habit rather than judgment; (4) reporting only the direct map, although the indirect map is where MICMAC adds value over a simple scoring exercise; and (5) treating the map as a statistical test. MICMAC structures expert judgment; the results are only as good as the panel and the variable definitions.
Frequently asked questions
Where is MICMAC software available?
MICMAC was first distributed as a Windows program by LIPSOR, the foresight laboratory led by Michel Godet in Paris. Today the strategic foresight tools designed by Godet and François Bourse, including MICMAC and MACTOR, are offered online through Futuribles. Because the calculation is only matrix multiplication, it can also be reproduced in Excel, R, or Python, as in the workbook above.
How many experts are needed for MICMAC analysis?
There is no fixed statistical minimum, because MICMAC structures expert judgement rather than sampling a population. A diverse group of about five to twelve people works well. Godet recommends not exceeding about twelve people in one group and splitting larger groups into subgroups. An odd number makes it easier to take the mode of the scores.
What does P mean in the MICMAC matrix?
P stands for potential influence: a relationship that does not exist today but could appear in the future, for example a new market regulation. MICMAC can compute a separate potential map in which P cells are given a value, showing how the system would change if those potential influences became real.
What is the difference between MICMAC and ISM?
Interpretive structural modeling (ISM) builds a hierarchy of variables from a binary reachability matrix (yes or no influence). MICMAC uses graded scores and matrix powers to rank variables by influence and dependence. Many studies combine them as ISM-MICMAC: ISM gives the levels of the hierarchy, and MICMAC classifies the variables into the four zones.
How many iterations should MICMAC use?
The number of iterations should be large enough for the ranking of influence and dependence to stop changing; in most matrices this happens after a few multiplications. The power or number of iterations should be reported, together with a check that one more iteration does not change the order of the top variables.
References and further reading
- Godet, M. (2006). Creating Futures: Scenario Planning as a Strategic Management Tool (2nd ed.). Economica.
- Arcade, J., Godet, M., Meunier, F., & Roubelat, F. Structural analysis with the MICMAC method and actors’ strategy with the MACTOR method. In J. C. Glenn & T. J. Gordon (Eds.), Futures Research Methodology. The Millennium Project.
- Indonesian version of this tutorial, with screenshots of the MICMAC software: Tutorial MICMAC Analysis: Tahapan dan Interpretasi.
- Rapfish in R (Indonesian): Tutorial Rapfish di R.



Discussion
No comments yet. Have a question about this topic? Write it below and I will do my best to answer.